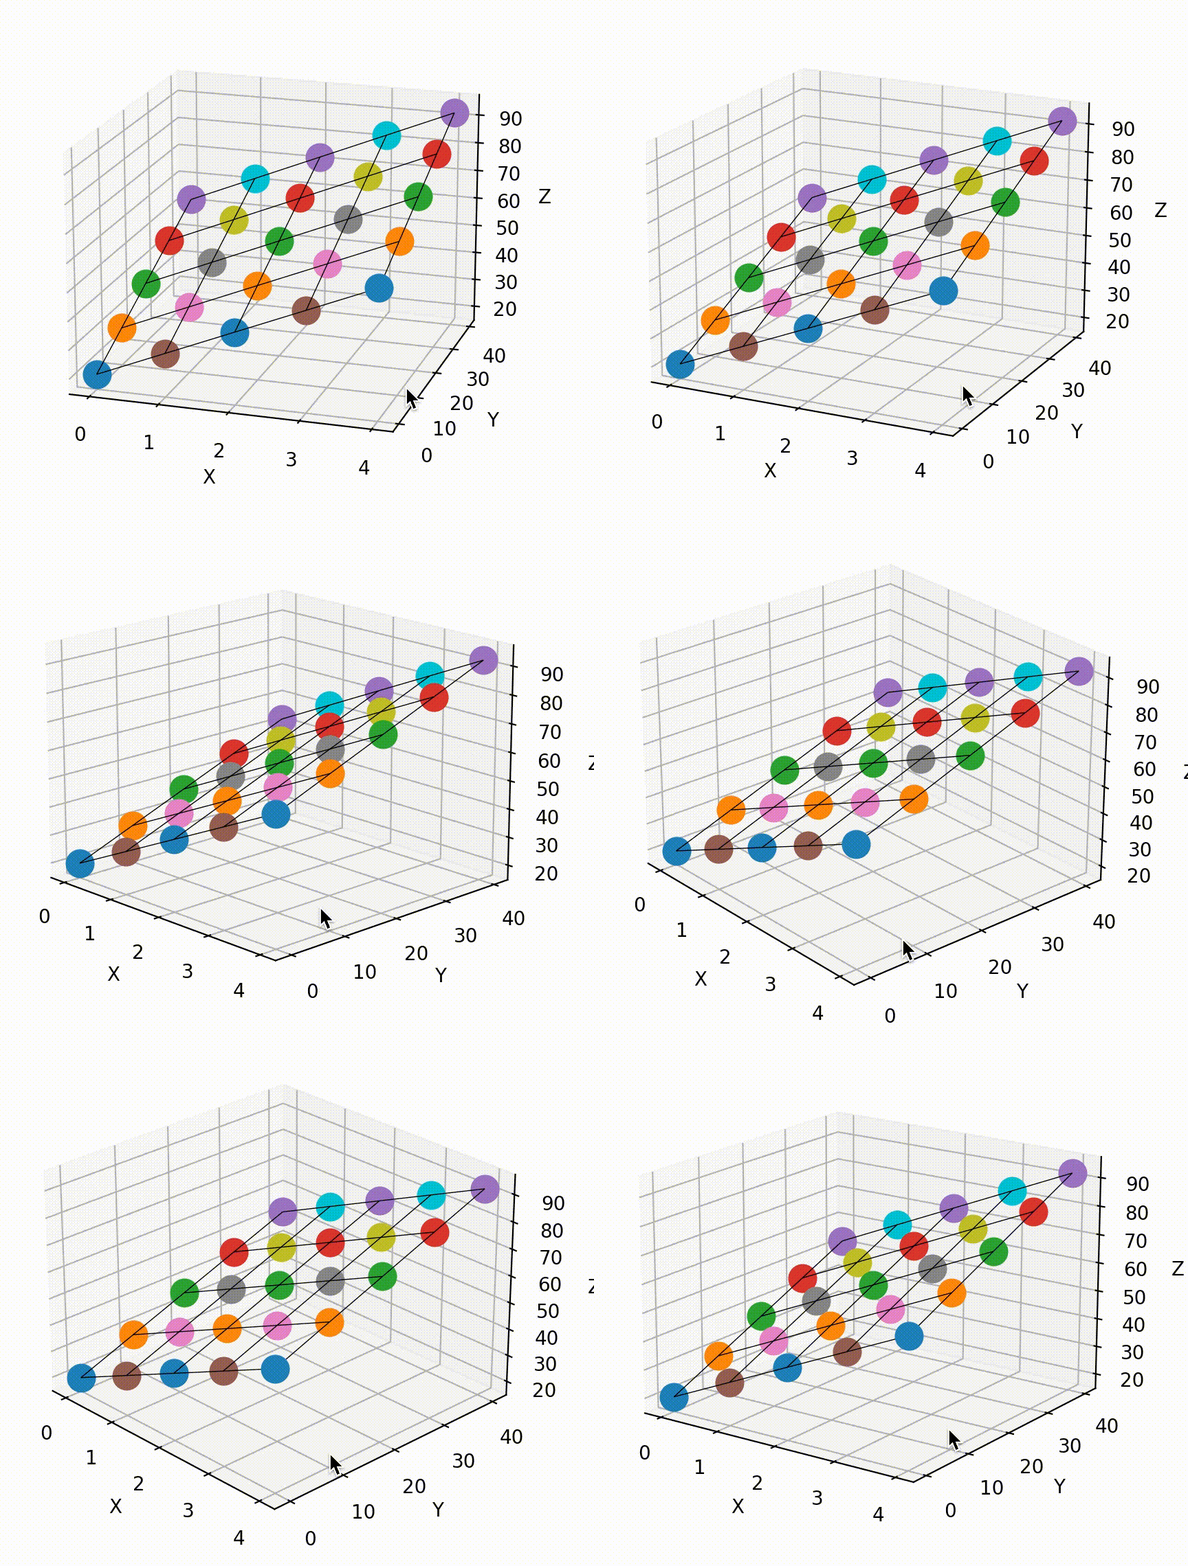


How can you re-create this?
Pip-install matplotlib and numpy
pip install matplotlibMatplotlib also installs numpy automatically.
Copy and paste the code.
import matplotlib.pyplot as plt
import numpy as np

def predict(x, y):
    return x * 10 + y * 0.8 + 20

x_axis = [0, 1, 2, 3, 4]
y_axis = [0, 10, 20, 30, 40]

X, Y = np.meshgrid(x_axis, y_axis)
Z = predict(X, Y)

fig = plt.figure()
ax = fig.add_subplot(projection='3d')
ax.plot_wireframe(X, Y, Z, rstride=1, cstride=1, linewidth=0.5, edgecolor='black')

for x in x_axis:
    for y in y_axis:
        ax.scatter(x, y, predict(x, y), s=200)

ax.set_xlabel('X')
ax.set_ylabel('Y')
ax.set_zlabel('Z')
plt.show()